
Open-Access Data
Open-access datasets supporting large-scale modeling, synthetic population research, and policy analysis.
Image

These datasets share a common design: all measures are standardized to 2020 Census geographies using area-weighted or population-weighted crosswalks, enabling direct linkage across demographic, economic, health, and infrastructure indicators without the boundary mismatches that typically complicate multi-source analysis. Each dataset includes block group, tract, and county estimates with consistent column schemas, making them immediately interoperable.
Image

A gravity-model index quantifying how easily residents can reach jobs, linking LEHD-LODES workplace counts to block group centroids with distance decay. Communities with low scores face longer commutes and fewer economic opportunities.
Schroeder, A. (2026). Social Data Commons: Employment Access Index (v2.0.0) (2.0.0) [Data set]. Zenodo. https://doi.org/10.5281/zenodo.18871546
Schroeder, A. (2026). Social Data Commons: Employment Access Index (v2.0.0) (2.0.0) [Data set]. Zenodo. https://doi.org/10.5281/zenodo.18871546
Image

The Townsend Index combining unemployment, overcrowding, lack of vehicle access, and renter-occupied housing into a single composite score, identifying neighborhoods where compounding disadvantages create the greatest barriers to well-being.
Schroeder, A. (2026). Social Data Commons: Material Deprivation (v1.0.0) (1.0.0) [Data set]. Zenodo. https://doi.org/10.5281/zenodo.18914764
Schroeder, A. (2026). Social Data Commons: Material Deprivation (v1.0.0) (1.0.0) [Data set]. Zenodo. https://doi.org/10.5281/zenodo.18914764
Image

Housing + Transportation Affordability Index — Independently reproduced from CNT's published methodology using ACS, LEHD, GTFS, and TIGER data at block group resolution. Reveals the true cost of housing by including modeled transportation costs — auto ownership, VMT, and transit use — as a share of household income. Annual updates from 2015–2024.
Schroeder, A. (2026). Social Data Commons: Housing + Transportation Affordability (v3.1.1) (3.1.1) [Data set]. Zenodo. https://doi.org/10.5281/zenodo.19008543
Schroeder, A. (2026). Social Data Commons: Housing + Transportation Affordability (v3.1.1) (3.1.1) [Data set]. Zenodo. https://doi.org/10.5281/zenodo.19008543
Image

A composite linking CMS Medicare physician enrollment to census tracts via HUD ZIP-to-tract crosswalks, computing population-to-physician ratios within 30 OSRM-derived driving miles and combining with ACS uninsured rates. This multi-source integration produces a unified accessibility measure that no single federal dataset provides.
Schroeder, A. (2026). Social Data Commons: Access to Care (HOI) (v2.0.0) (2.0.0) [Data set]. Zenodo. https://doi.org/10.5281/zenodo.18913512
Schroeder, A. (2026). Social Data Commons: Access to Care (HOI) (v2.0.0) (2.0.0) [Data set]. Zenodo. https://doi.org/10.5281/zenodo.18913512
Image

Independently computed from 16 ACS variables using CDC/ATSDR 2022 methodology, available at block group resolution with annual updates — avoiding the one-to-two-year lag and tract-only limitation of pre-published CDC SVI files.
Schroeder, A. (2026). Social Data Commons: Social Vulnerability Index (v2.0.0) (2.0.0) [Data set]. Zenodo. https://doi.org/10.5281/zenodo.19024474
Schroeder, A. (2026). Social Data Commons: Social Vulnerability Index (v2.0.0) (2.0.0) [Data set]. Zenodo. https://doi.org/10.5281/zenodo.19024474
Image

Exact Kotelchuck classification from NCHS natality microdata (2014–2020), extended through 2024 by projecting county-specific trends from CDC WONDER trimester-of-entry queries. This hybrid approach provides more timely estimates of prenatal care gaps than waiting for microdata releases.
Schroeder, A. (2026). Social Data Commons: Prenatal Care Adequacy (Kotelchuck Index) (v4.0.3) (4.0.3) [Data set]. Zenodo. https://doi.org/10.5281/zenodo.19039389
Schroeder, A. (2026). Social Data Commons: Prenatal Care Adequacy (Kotelchuck Index) (v4.0.3) (4.0.3) [Data set]. Zenodo. https://doi.org/10.5281/zenodo.19039389
Image

Three floating catchment area variants (2SFCA, E2SFCA, 3SFCA with Gaussian decay) measuring spatial accessibility at block group level using CMS provider data and OSRM travel time matrices. Captures competitive dynamics of shared catchments that simple provider-to-population ratios miss.
Schroeder, A. (2026). Social Data Commons: Primary Care Service Accessibility (FCA) (v4.0.1) (4.0.1) [Data set]. Zenodo. https://doi.org/10.5281/zenodo.19152538
Schroeder, A. (2026). Social Data Commons: Primary Care Service Accessibility (FCA) (v4.0.1) (4.0.1) [Data set]. Zenodo. https://doi.org/10.5281/zenodo.19152538
Image

Floating catchment area analysis linking CMS pediatric provider data to child population demand (ages 0–17) within OSRM travel time catchments. Reveals accessibility gaps in suburban and rural areas where providers cluster in distant population centers.
Schroeder, A. (2026). Social Data Commons: Pediatric Service Accessibility (FCA) (v2.0.0) (2.0.0) [Data set]. Zenodo. https://doi.org/10.5281/zenodo.19152601
Schroeder, A. (2026). Social Data Commons: Pediatric Service Accessibility (FCA) (v2.0.0) (2.0.0) [Data set]. Zenodo. https://doi.org/10.5281/zenodo.19152601
Image

OB-GYN Physician Accessibility — Floating catchment area analysis using female population age 15+ as the demand measure, capturing accessibility barriers at sub-county resolution that designation-based metrics like HPSAs do not reflect.
Schroeder, A. (2026). Social Data Commons: OB-GYN Service Accessibility (FCA) (v2.0.0) (2.0.0) [Data set]. Zenodo. https://doi.org/10.5281/zenodo.19152569
Schroeder, A. (2026). Social Data Commons: OB-GYN Service Accessibility (FCA) (v2.0.0) (2.0.0) [Data set]. Zenodo. https://doi.org/10.5281/zenodo.19152569
Image

Residential racial and ethnic segregation measured as the Entropy Index (Theil's H) across eight categories. Segregation is one of the strongest predictors of disparities in health, education, and economic mobility.
Schroeder, A. (2026). Social Data Commons: Segregation (HOI) (v1.0.0) (1.0.0) [Data set]. Zenodo. https://doi.org/10.5281/zenodo.18914969
Schroeder, A. (2026). Social Data Commons: Segregation (HOI) (v1.0.0) (1.0.0) [Data set]. Zenodo. https://doi.org/10.5281/zenodo.18914969
Image

Age-stratified floating catchment area ratios of childcare seats per child, minimum drive times, and total capacity using VDSS facility data and OSRM travel times. Childcare access is a critical determinant of labor force participation, particularly for women and low-income families.
Schroeder, A. (2026). Social Data Commons: Daycare Accessibility (v1.2.0) (1.2.0) [Data set]. Zenodo. https://doi.org/10.5281/zenodo.19139080
Schroeder, A. (2026). Social Data Commons: Daycare Accessibility (v1.2.0) (1.2.0) [Data set]. Zenodo. https://doi.org/10.5281/zenodo.19139080
Image

Independently computed annual series (2017–2023) combining LEHD employment entropy, GTFS transit proximity, and EPA street intersection density. This multi-year time series on consistent 2020 geographies enables trend analysis that the EPA's static Smart Location Database does not support.
Schroeder, A. (2026). Walkability Index (v4.0.0) (4.0.0) [Data set]. Zenodo. https://doi.org/10.5281/zenodo.18906558
Schroeder, A. (2026). Walkability Index (v4.0.0) (4.0.0) [Data set]. Zenodo. https://doi.org/10.5281/zenodo.18906558
Image

Fixed and mobile broadband speeds derived from Ookla Speedtest tiles spatially joined to Census block groups with device-count weighting. Converts raw crowdsourced speed test data into standardized measures at block group, tract, and county levels for digital divide analysis.
Schroeder, A. (2026). Social Data Commons: Ookla Speed (v2.0.0) (2.0.0) [Data set]. Zenodo. https://doi.org/10.5281/zenodo.19192908
Schroeder, A. (2026). Social Data Commons: Ookla Speed (v2.0.0) (2.0.0) [Data set]. Zenodo. https://doi.org/10.5281/zenodo.19192908
Image

Synthetic population, contact network, and COVID-like disease simulations. Available for Virginia (~7.7M) and the United Kingdom (~62M).
Image
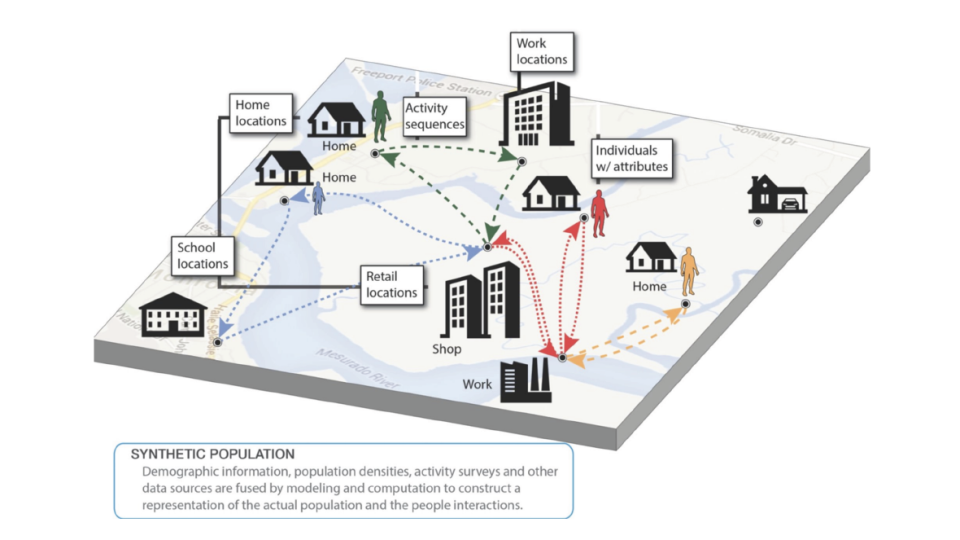
Synthetic populations for countries and states, including demographics, households, daily activities, and interaction locations.
Image

COVID-19 NPI policy dataset for Virginia localities, with start and end dates for mask, business, school, college, and religious organization mandates.
Image

Precalculated global mobility networks for metapopulation SEIR simulations compatible with PatchSim.
Image

Reformatted origin-destination mobility matrices from Baidu for research use and epidemic model calibration.