
Cyberinfrastructure
Web-based applications and dashboards for data exploration, visualization, and computational analysis.
Image

Web-based engine for exploring and visualizing synthetic (digital twin) populations and their demographic and activity structures.
Image

Web-based visualization platform for exploring synthetic animal and agricultural populations for transboundary disease modeling.
Image

This is a dedicated platform for advanced pathogen analysis and collaborative data management. This site is designed to provide robust tools for running complex genomics analysis workloads and a secure environment for storing and sharing crucial data. Harness the power of cutting-edge technology and collaborative features to accelerate your discoveries and enhance the impact of your research in pathogen genomics.
Image
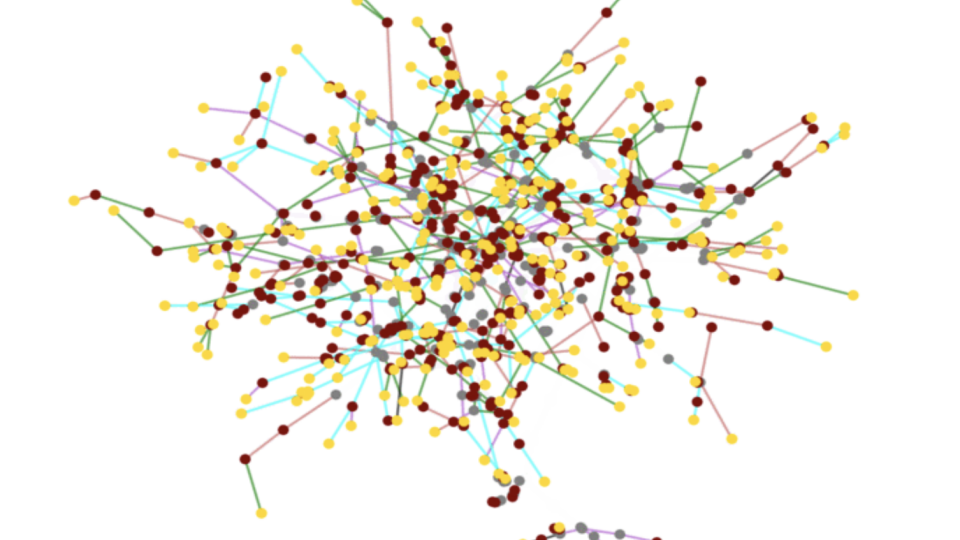
Web application for designing, executing, and analyzing computational epidemiology experiments under varied conditions and intervention strategies.
Image

Web-based research platform supporting data access and analysis for bacterial and viral infectious diseases.
Image

Interactive web platform for discovering datasets and networks and submitting analytical tasks on shared or uploaded data.
Image

This dashboard was essential in our support of the planning and response efforts for the COVID-19 pandemic. This visualization tool provides a unique way of examining data curated by different data sources.
Image

Interactive tool for extracting insights from epidemiological time series data and identifying activity markers over time.
Image

Web demonstration for identifying target RNA secondary structures from an ensemble using interactive visualization.