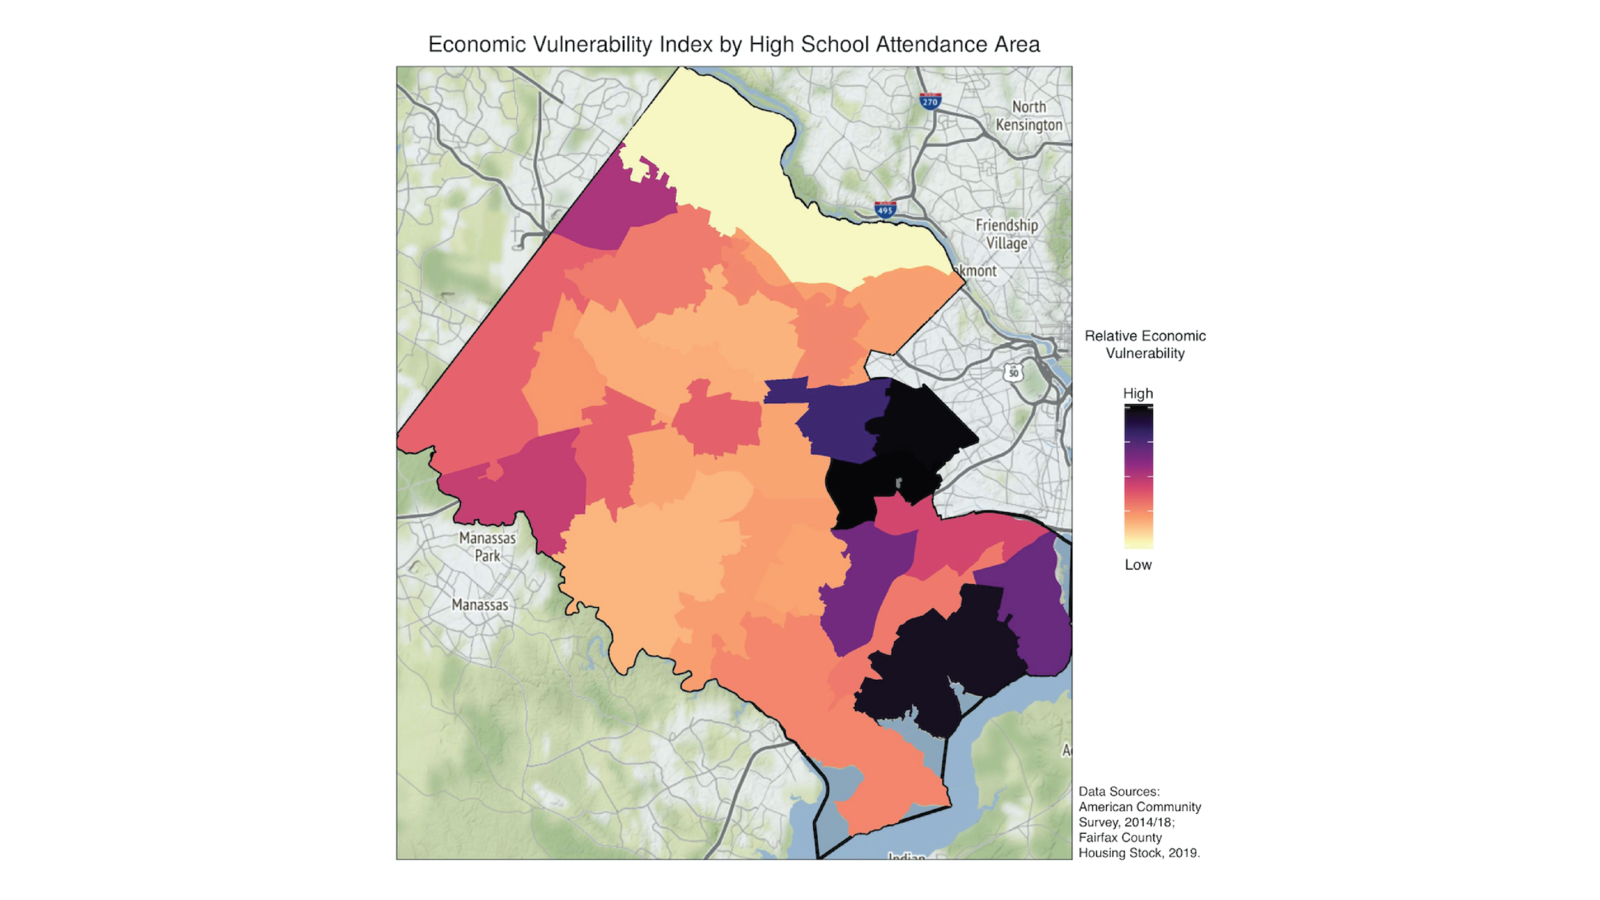
Mapping Economic Vulnerability
Our collaboration first explored neighborhood economic vulnerability. We developed a synthetic population dataset to examine disparities among geographical units that matter to decision-makers, rather than using administrative groupings. We constructed a composite index summarizing resident sociodemographic and socioeconomic characteristics, and mapped disadvantaged high school attendance areas and supervisor districts. Our maps helped Fairfax County identify areas that could benefit from targeted programs addressing economic vulnerability.
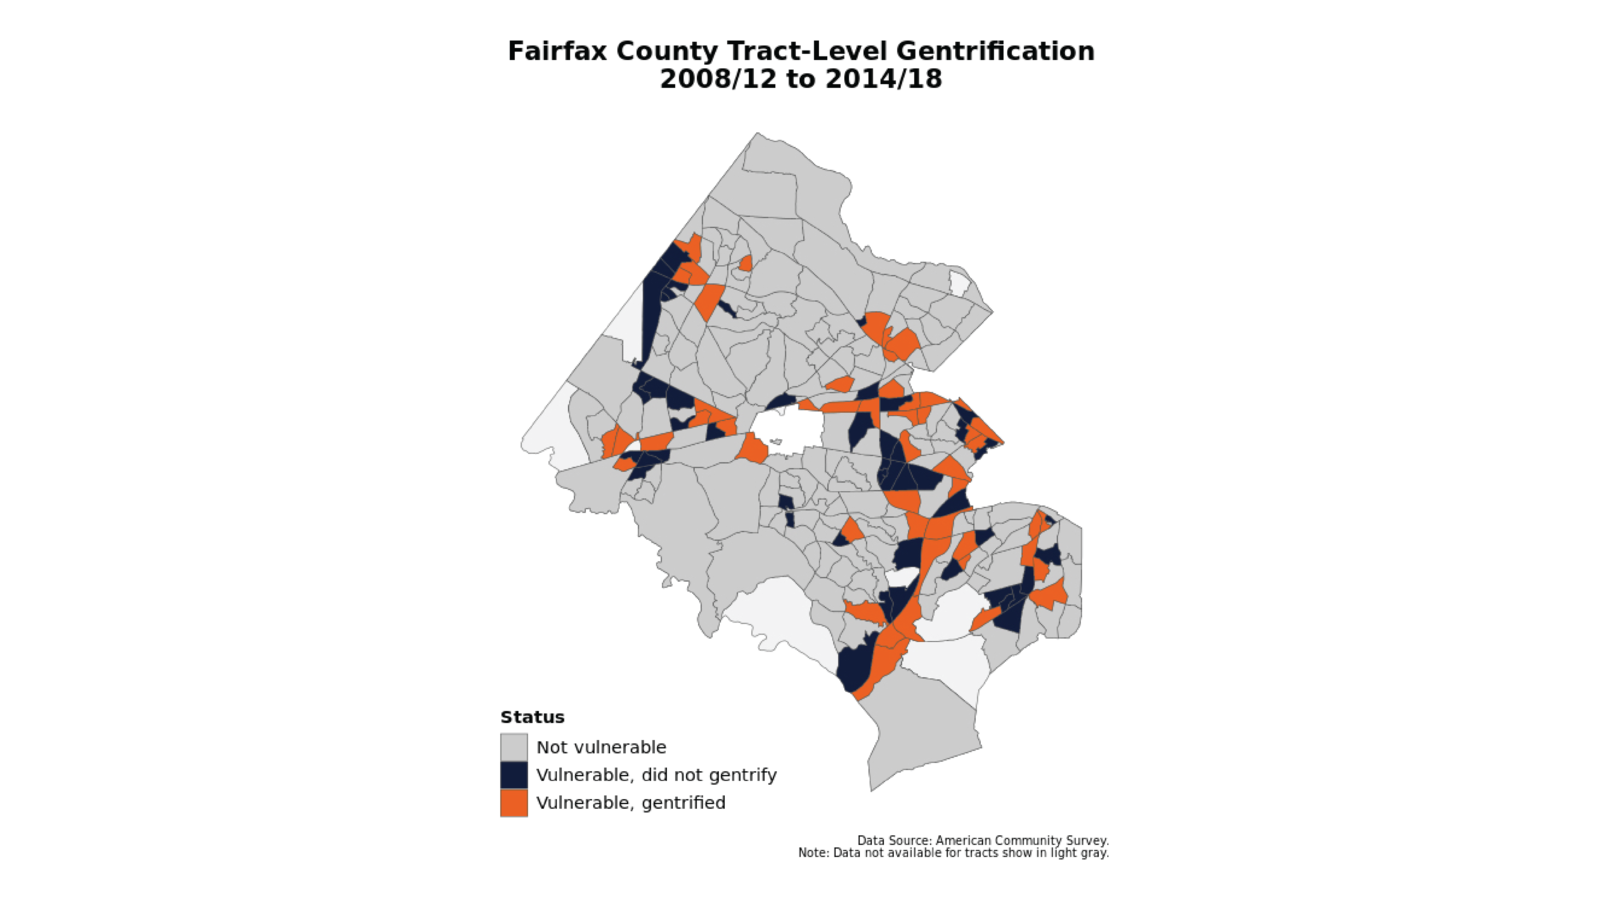
Predicting Gentrification
The second stage of our partnership investigated neighborhood change in Fairfax County. We used population and housing change indicators to highlight county census tracts vulnerable to gentrification and developed a spatial model that identified factors associated with neighborhood change. We tested the effects of a hypothetical housing intervention, showing a reduction in the number of potentially gentrified areas. Our initial predictions provided insights on how policy changes could affect the county before implementation, informing county efforts to improve neighborhood outcomes and allow residents to remain in their homes.
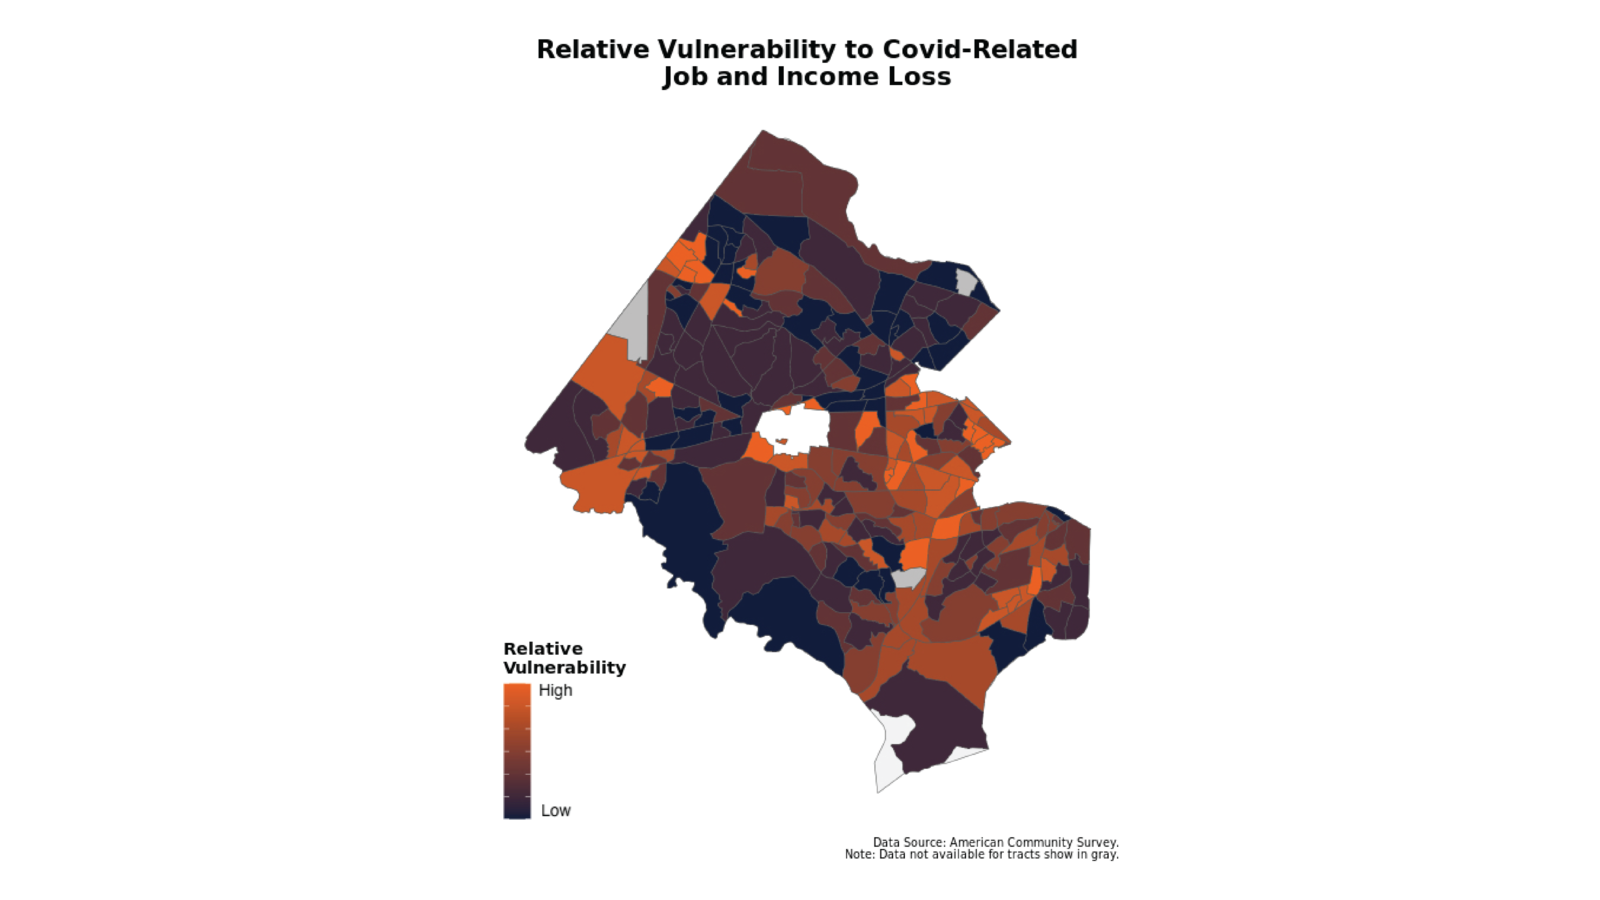
Tracing Job Flows
In light of the global pandemic, we worked together with the county’s Economic Development Authority to characterize local labor markets and provide insights that could guide economic recovery. We developed a summary index that highlighted areas with workers at high risk for pandemic-related job and income loss. We also used network analysis to explore commute flows and identify where employees may have difficulties returning to offices given public transit shutdowns.
Figures