
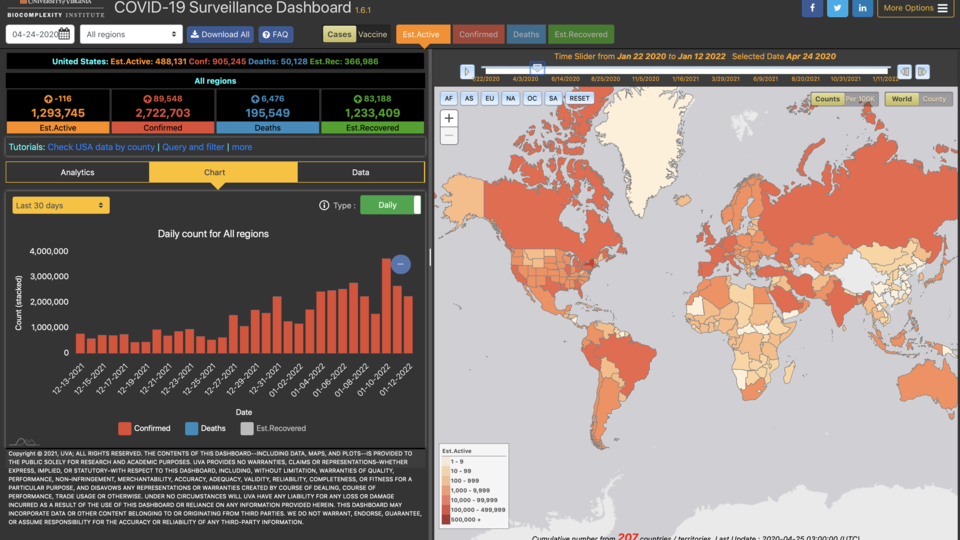
The University of Virginia’s Biocomplexity Institute has released an enhanced version of its popular COVID-19 Surveillance Dashboard with new features including county-level data for the United States and state/province-level data for 15 other countries.
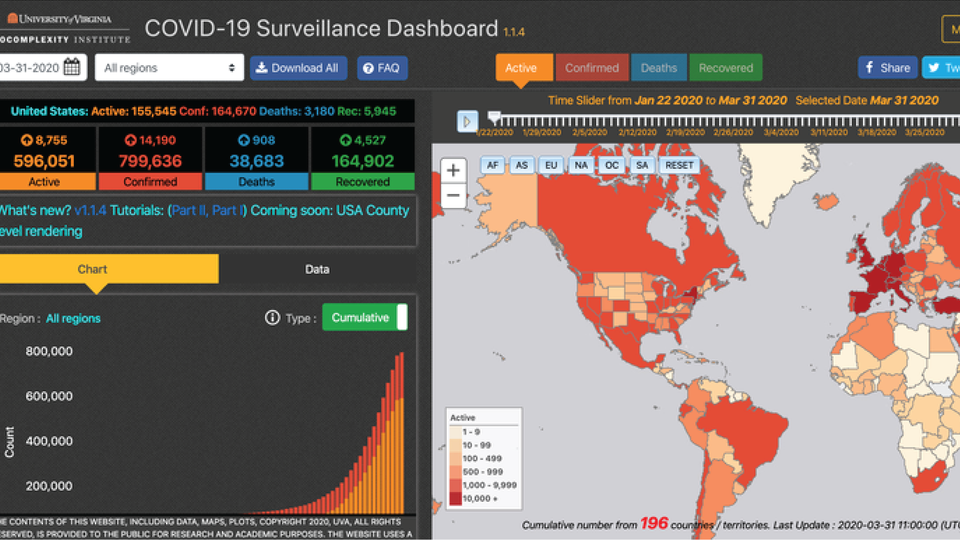
There are now dozens of online dashboards and maps showing exactly how COVID-19 is spreading across the world.

The many unknowns about COVID-19 – including its precise origin, how long the disease incubates, and when during the incubation people become contagious – have made data collection, and therefore, identification of effective intervention methods challenging. In response to this global pandemic, researchers from the University of Virginia’s Biocomplexity Institute have developed a set of visualization and analytical web applications to help provide a better understanding of the epidemic’s scope and aid in bringing the outbreak to a swift conclusion.
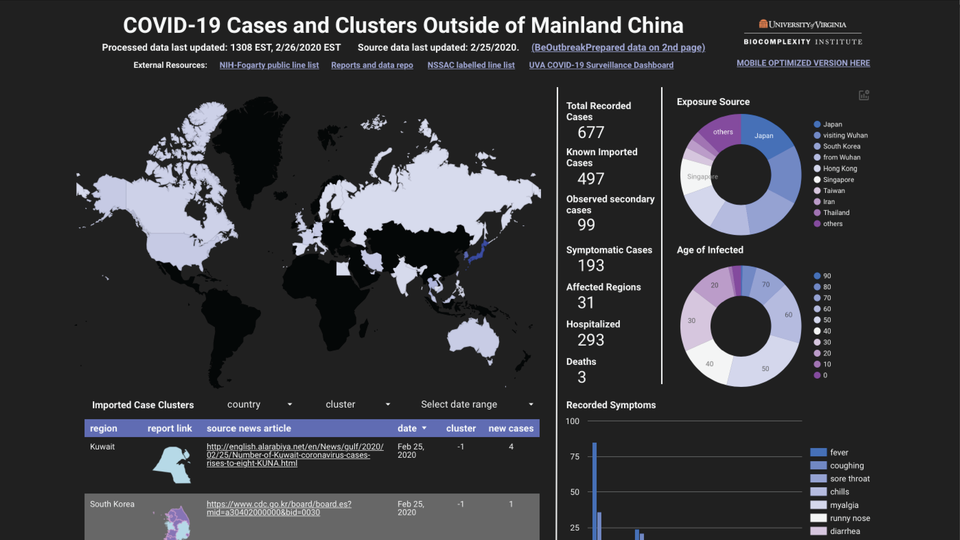
Researchers at the University of Virginia Biocomplexity Institute have collected data on the coronavirus and turned it into interactive dashboards online.