magnifying glass on the horizon

Project Details

Funding Agency

National Center for Science and Engineering Statistics

Natural language processing and machine learning are powerful techniques for extracting knowledge from the volumes of text-based data available. Collaborating with our agency partner, the National Center for Science and Engineering Statistics (NCSES), we are using administrative data from Federal RePORTER to identify the range of R&D topics funded by federal science and technology agencies, including emerging research areas.

We find and visualize 'hot' and 'cold’ R&D topics - those that increase or decrease in popularity across time. This research enhances traditional survey approaches based on data collected through the NCSES Survey of Federal Funds for Research and Development and Survey of Federal Science and Engineering Support to Universities, Colleges, and Nonprofit Institutions.


Project Overview

Federal RePORTER summarizes information about scientific awards granted by the federal government, which makes it a reliable source for building a data set comprised of R&D projects. Starting with abstracts and project information for more than one million R&D grants entered into the Federal RePORTER system from 2008 to 2019, we wrangle the data to facilitate the natural language processing approach, from imputing missing information, removing duplicate abstracts, and cleaning the abstracts using standard natural language processing steps. These steps include lemmatization, stop word removal, and applying bi-and tri-grams definitions.

Detecting Emerging R&D Topics

Topic modeling is a machine learning method used to identify underlying themes (i.e., topics) within a corpus of documents, where each document is composed of multiple topics. Based on testing different topic modeling algorithms, we selected non-negative matrix factorization (NMF) as the most accurate for our corpus of data. The NMF approach assigns a weight for each word in each document and penalizes words that appear in many documents in the corpus. 

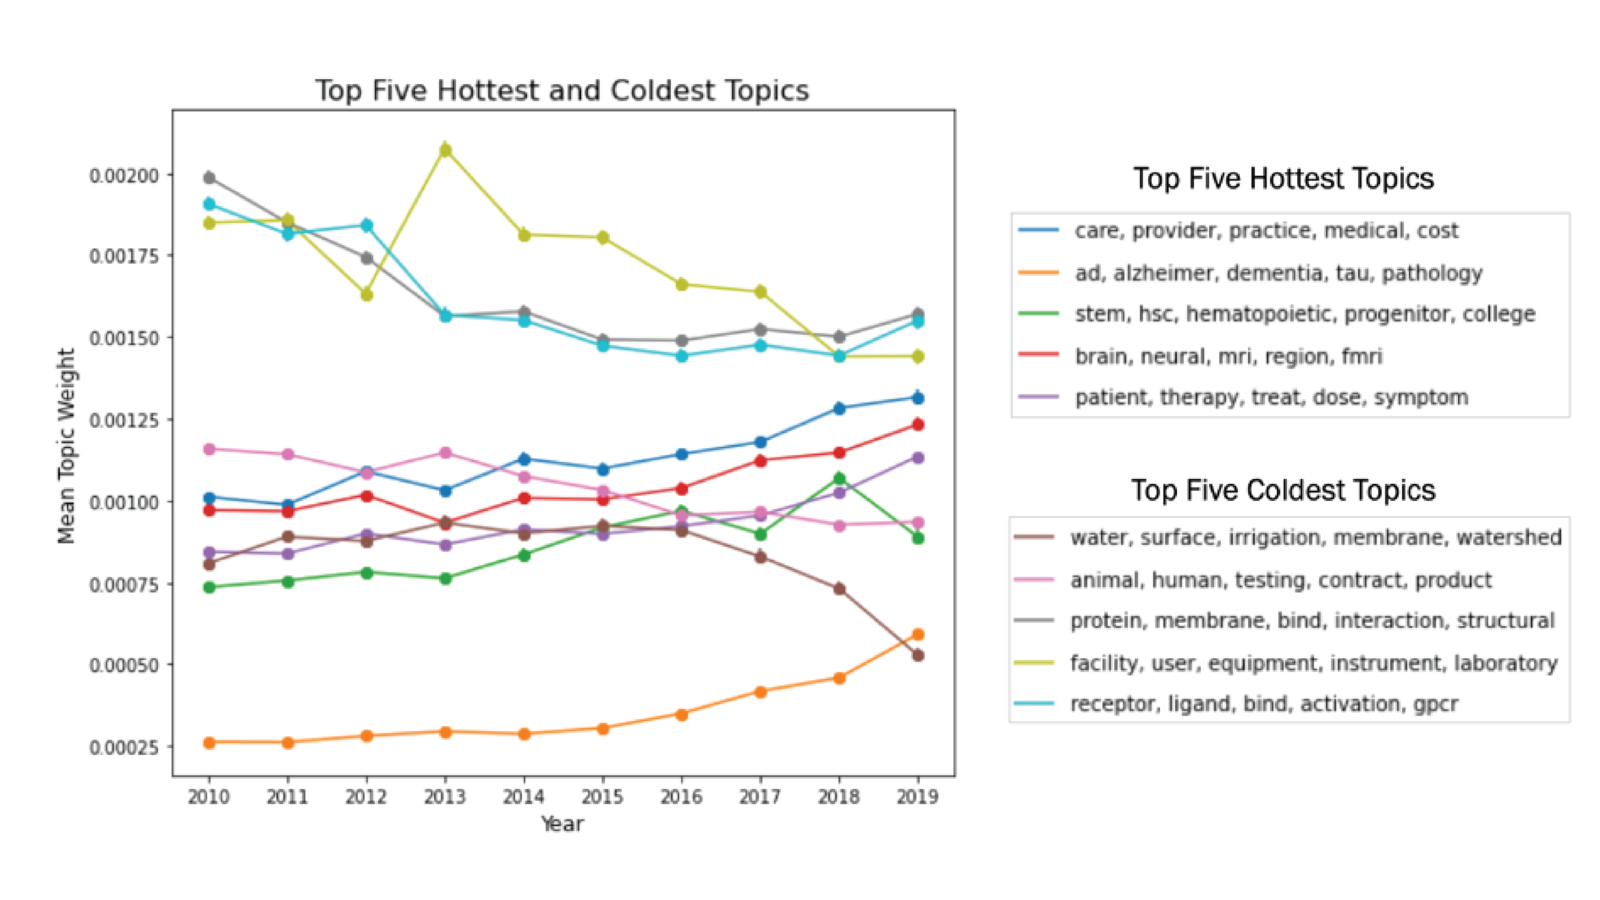
The topics that emerged from our analysis represent content areas within this corpus of federally funded R&D projects. The top five hot topics (increasing popularity over time) and cold topics decreasing popularity over time) are presented in Figure 1. These hot and cold topics are defined by larger positive and negative slopes of their respective regression lines. The coldest topics can still be popular, but just trending downward in prevalence.

Pandemics Case Study

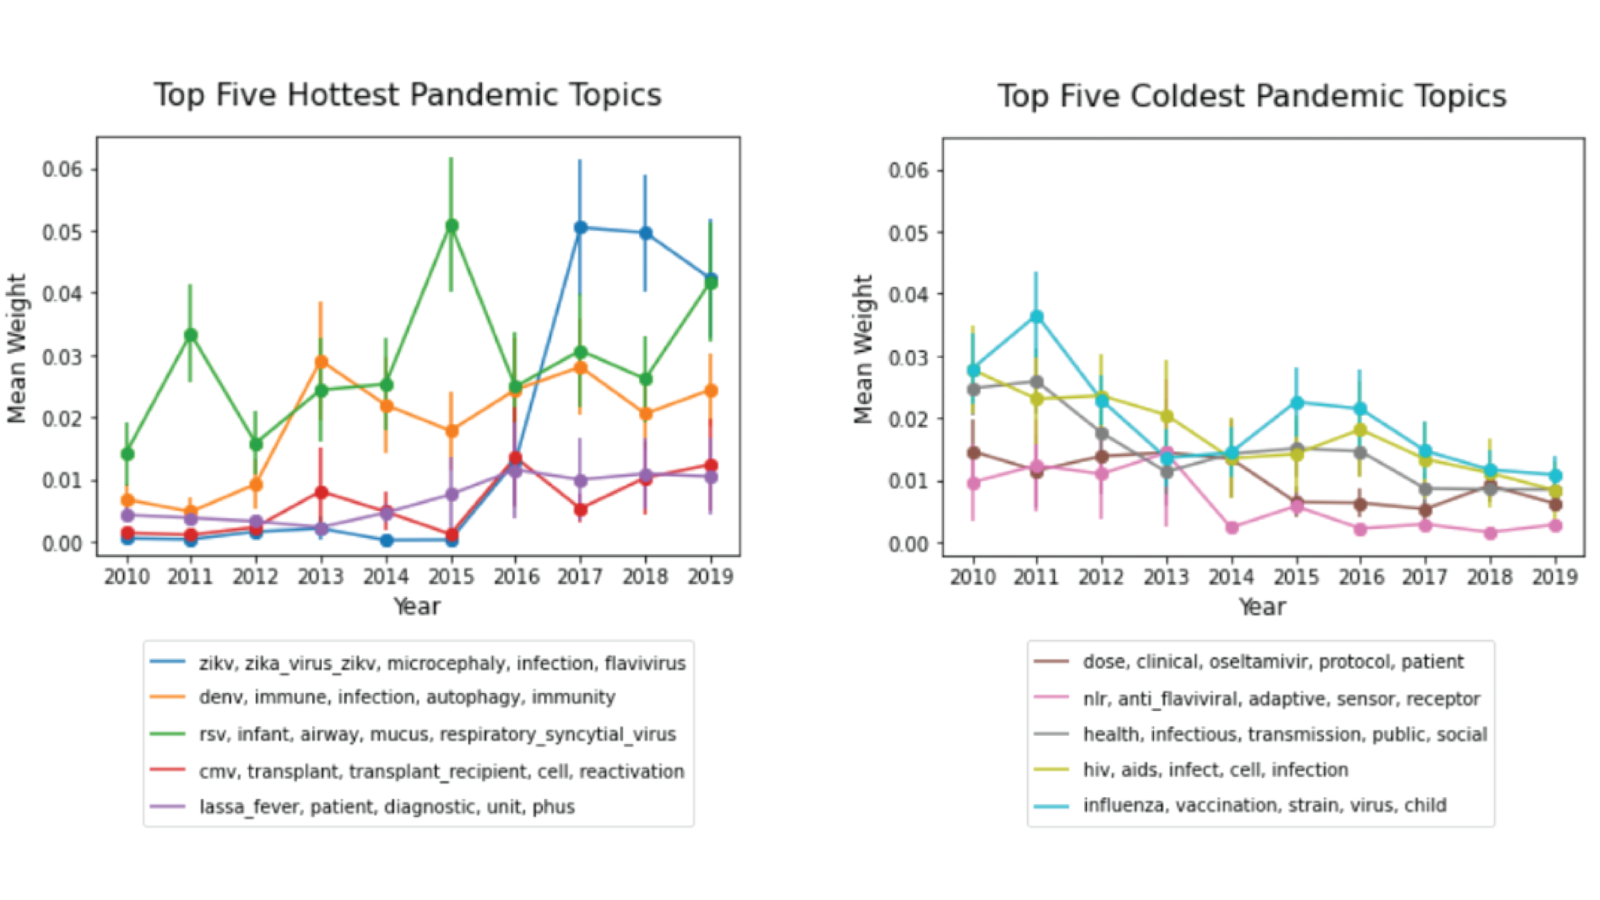
As a new coronavirus creates a crisis unprecedented in our lifetimes, there is a surging interest in pandemic research. This case study presents R&D trends in pandemics and closely related research. The five hottest and coldest pandemic R&D topics are presented in Figure 2. The results show a sharp increase in Zika virus research after the outbreak in 2015-2016 (see hottest topics chart) and an increase in research in influenza in 2010 and 2011 after the swine flu pandemic in 2009-2010 (see coldest topics chart).

Hottest and Coldest R&D Topics
Figure 1. The five ‘hot’ and ‘cold’ topics for the 2008-2019 R&D abstracts in Federal RePORTER are generated using the non-negative matrix factorization (NMF) topic model. Hot and cold topics are defined by larger positive and negative slopes of their respective regression lines. The error bars are the standard errors and represent the uncertainty or variation of the corresponding coordinate for each point (weighted count of topics by year). The legends display the five words most highly associated with each of the generated hot and cold topics. Data Source: Federal RePorter, 2008-2019, University of Virginia, Social and Decision Analytics Division computations.
Hottest and Coldest Pandemic R&D Topics
Figure 2. The top five hottest and coldest pandemic topics for the 2008-2019 research abstracts in Federal RePORTER are generated using the non-negative matrix factorization (NMF) topic model. Hot and cold topics are defined by larger positive and negative slopes of their respective regression lines. The error bars are the standard errors and represent the uncertainty or variation of the corresponding coordinate for each point (weighted count of topics by year). The legends display the five words most highly associated with each of the generated topics. Data Source: Federal RePorter, 2008-2019, University of Virginia, Social and Decision Analytics Division.
Findings

We implemented natural language processing for specific areas of interest by combining a search engine strategy and topic modeling. This can quickly give users a "deeper dive" into a specific area and allows for finer-grained topics. Our dashboard provides results and documentation for the project.