University of Virginia Biocomplexity Institute Launches National COVID-19 Medical Resource Demand Dashboard
As COVID-19 cases reach record numbers and are anticipated to escalate with increased holiday travel, the University of Virginia Biocomplexity Institute has launched a national COVID-19 Medical Resource Demand Dashboard that can project weekly COVID-19 hospitalization rates and the percentage of occupied hospital beds up to six weeks in advance. This groundbreaking prediction tool provides a clearer picture of anticipated demand, enabling local public health officials—including emergency managers and hospital administrators—to better anticipate where and when action will be needed to mitigate the impact on medical facilities.
This dashboard is the only one of its kind to combine multiple forecasting models to project future hospitalization rates and bed occupancy, and that allows users to adjust projections based on multiple factors (including the percentage of non-COVID hospital patients and the average duration of patient stays) to better assess future demand and needs.
The tool depicts how hospital capacity projections can shift under different scenarios. Currently, the tool shows scenarios that factor in a more controlled (15 percent decrease) versus less controlled (15 percent increase) community spread of COVID-19. These projections are obtained using a meta-population-based mechanistic model; this approach divides the total population into subgroups that influence infectious disease dynamics, and captures underlying causal mechanisms of how COVID-19 spread compares with known infectious disease patterns. The Biocomplexity Institute team periodically adjusts the scenarios to factor in new pandemic conditions and developments, and planned policy adjustments as they arise, to better address public health planning needs; the impending impact of vaccine distribution will likely be factored into future scenarios.
Data can be viewed both at a national level as well as for all 306 Hospital Referral Regions in the country. A video tutorial that explains how to use the dashboard can be found here.
The Biocomplexity Institute, an interdisciplinary research group that works to solve complex issues surrounding life and its environment, has partnered directly with the Virginia Department of Health and federal agencies since early February, providing data and predictive modeling resources to decision makers leading the response to the pandemic. It initially developed the dashboard for use at the state level in Virginia, but expanded it to a national scope as COVID-19 cases began surging again.
“This tool has been important to our partners at the Virginia Department of Health in their planning, and we are pleased to bring this tool to the nation to help inform decisions as cases spike and resources are strained across the country,”
said Mandy Wilson, lead developer of the dashboard and research scientist at the Biocomplexity Institute.
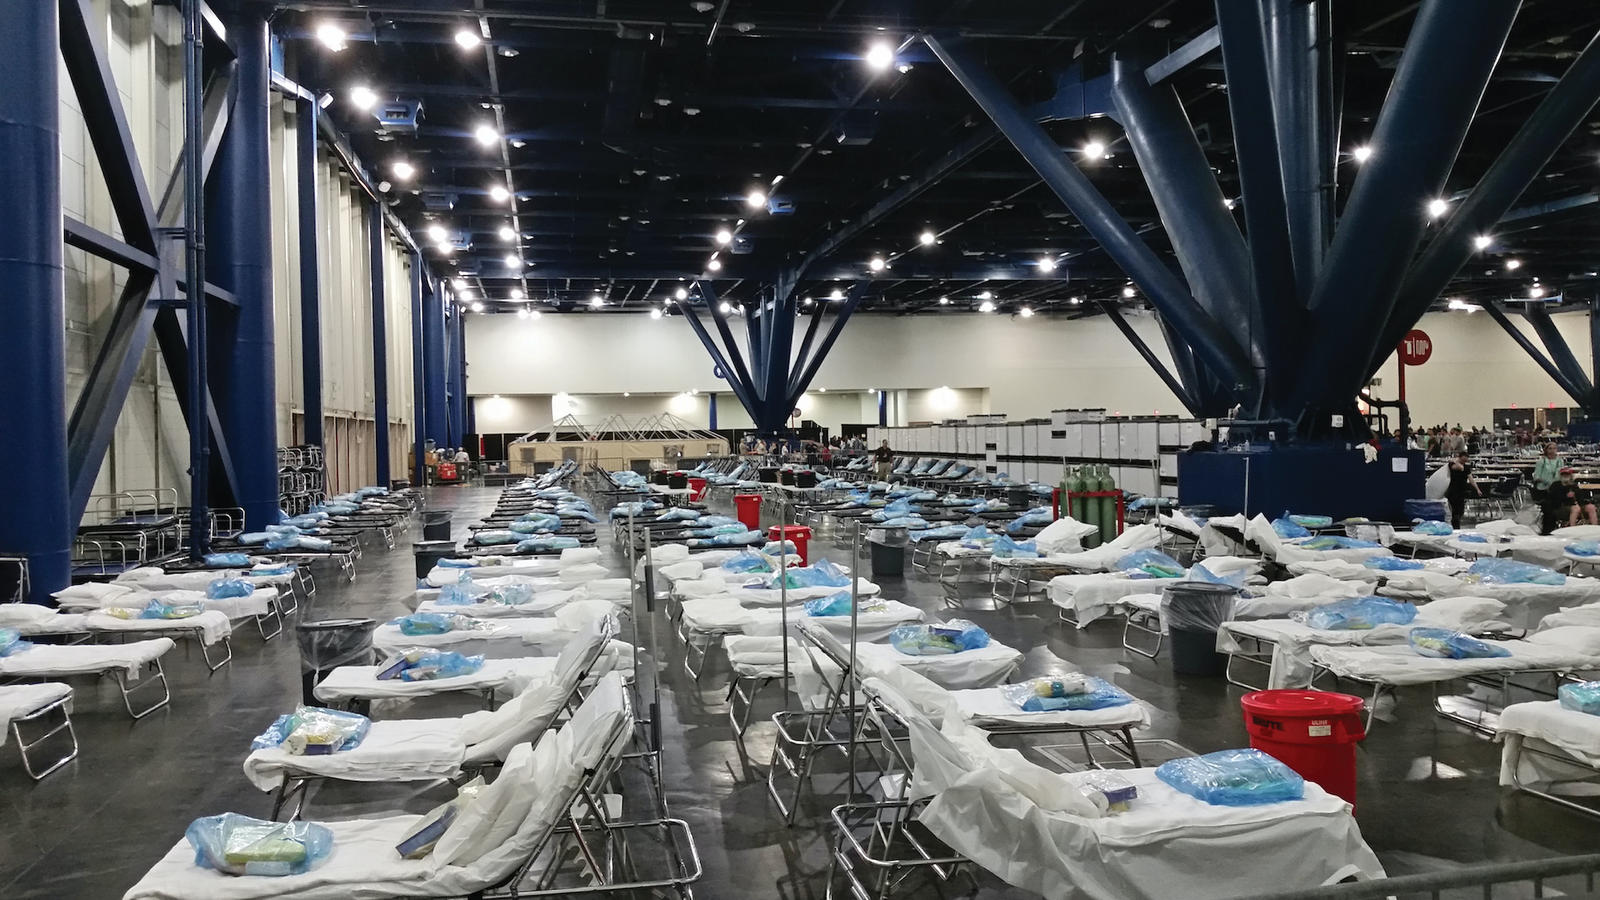
The dashboard’s projection tools allow key officials to easily see and understand when hospitals will exceed capacity, and plan accordingly for when emergency measures will need to be activated, such as constructing temporary field hospitals or shifting personnel or other resources.
“Models like these can make data come to life, and are easier to interpret,” said Bryan Lewis, a computational epidemiologist at the Biocomplexity Institute. “Presenting data in a visual, easy-to-understand manner can help ease burdens on healthcare decision makers at a crucial time.”
Not only can the newly expanded dashboard assist public health officials and policymakers, it can also provide real, trusted, and reliable data that helps improve the public’s understanding of how severe the COVID-19 caseload is in their region, and whether their local hospitals can handle predicted caseloads in the coming weeks. This can help individuals make informed decisions about risk in their daily life, including upcoming holiday travel, and potentially change their own behaviors.
In addition to this new medical resource projection dashboard, the Biocomplexity Institute has also developed a COVID-19 surveillance dashboard that provides current global case data as well as county-specific data for the United States. Together, these two dashboards provide comprehensive data about the current and future state of COVID-19 that can guide both public health leaders and the general public as they plan for the weeks ahead.
“This work is a timely example of how the Biocomplexity Institute uses data modeling to create innovative tools that advance the greater good,”
said Madhav Marathe, Director of the Network Systems Science and Advanced Computing (NSSAC) Division, Biocomplexity Institute. “Since the beginning of the pandemic, our team has worked diligently to develop, refine, and now expand this dashboard. We hope it will be a vital resource to public health leaders as they make critical decisions about COVID-19 strategies.”
To learn more about the Biocomplexity Institute, please visit biocomplexity.virginia.edu.